Turkey, candidate member for European Union (EU) since 2005, has recently started thinking that it is time to look for new opportunities. The fact that EU has been unfair for Turkey about various issues such as free-pass in Schengen Area and also economic crisis that EU has deeply suffered made Turkish people reconsider their opinions about EU. Shanghai Five, which is known as Shanghai Cooperation Organization (SCO) is a hot issue right now and Prime Minister of Turkey has mentioned about the possibility to be a part of the cooperation, instead of EU, even though it is assumed a really slight possibility.
The reason lays behind preparing the work is to identify countries that are members of SCO and show comparison in terms of some macroeconomic indicators between the organization members and Turkey, without any subjective mentions. Turkey, attended to last meeting of the Cooperation in 2012 as an observer, is also in talks with Russian Federation and China about the integration to the organization.
Shanghai Cooperation Organization which was formerly known as “Shanghai Five” was created by Russia, China, Kyrgyz Republic, Tajikistan and Kazakhstan in 1996. After addition of Uzbekistan in 2001, the organization has become Shanghai Cooperation Organization.
The official languages of SCO are Russian and Chinese, as it might be guessed. Beside members of SCO, observer nations, dialog partners and guest countries are also welcome to SCO’s meetings. The list of the countries and their status in SCO’s meetings are listed below.

Resource: http://www.sectsco.org
Summits of SCO, which are organized annually started, in Shanghai (China) in 2001 and the last summit was held in Bishkek, the capital of Kyrgyz Republic, on December 5th 2012.
The comparison has been done in 15 different indicators (Cost to Export, Cost to Import, Employment Ratio, Export Volume Index, Export Value Index, Import Volume Index, Import Value Index, net FDI, FDI inflows, FDI outflows, GDP, GINI Index, GDP growth, Unemployment and Population) in order to compare better Turkey with the Cooperation members.
After China (with population of 1.34 billion), Russia is the biggest country in SCO, in terms of population, while Kyrgyz Republic has the lowest with its 5.5 million people.
Figure-1. Population – Turkey and SCO excluding China (2004-2011)

Resource: The World Bank
The population of China is growing faster and faster every year. In a short time as 8 years, China's population grew around 50 million, which is around two third of Turkey's population.
Figure-2. Population - China (2004-2011)

Resource: The World Bank
China's GDP has been rising sharply every year and reached more than 7.000 billion of US $ at the end of 2011. Meanwhile, Russia had also an increasing trend between 2003 and 2008. Even though the global crisis affected Russia in 2009, they overcame this threat and saw their GDP around 1,800 billion of US $ in 2011. Turkey followed the same path with Russia, despite the tackle in 2009, they made well to put their GDP level almost 800 billion of US $ at the end of 2011.
Figure-3. GDP (2004-2011)

Resource: The World Bank
According to GDP change as percentage, it is obvious that China, Uzbekistan and Kazakhstan are the only countries that did not have a single decrease in their performances between 2003 and 2011. GDPs of both Russia and Turkey had fallen in 2009 due to crisis, but they recovered themselves but with a slight difference: Turkey's GDP change had been greater than Russian's.
Figure-4. GDP Growth (2004-2011)

Resource: The World Bank
GINI Index simply indicates the difference between poor people and rich people in the country. The measure is between 0 - 1, which getting to 0 means that economic differences between people in the country is decreasing while 1 means the huge differences in economic level of the people. Even though there is only one available data for China in terms of GINI Index, it is estimated that the index rate would be much higher (getting to 1). According to the common year for other members of SCO (2009), Kazakhstan’s GINI Index is the best while Turkey’s performance is also significant; at the end of 2008, Turkey’s index has decreased to 0.37. No data was available for Uzbekistan.
Figure-5. GINI Index (2004-2009)

Resource: The World Bank
Paul Ashworth, the chief North American economist for Capital Economics, mentions that the best measure of labor market conditions is employment population ratio which is a statistical ratio measuring the proportion of the country's working-age population (ages 15 to 64 in most OECD countries) that is employed. This also includes people that have stopped looking for work.
Among members of SCO, China has the best employment rate according to the figure 6 showing the employment to population ratio (15 and older). Approximately 70 % of China’s population is employed while Turkey has the lowest rate by around 42 %.
Figure-6. Employment Ratio (2004-2010)

Resource: The World Bank
Unemployment, which is critical for economies, indicates the share of the labor force that is without work but available for and seeking employment.
Comparing to total labor force, China has the best unemployment ratio by having around 4% while Turkey has the highest by almost 12% at the end of 2010. No data was available for Uzbekistan and Tajikistan.
Figure-7. Total Unemployment (2004-2010)

Resource: The World Bank
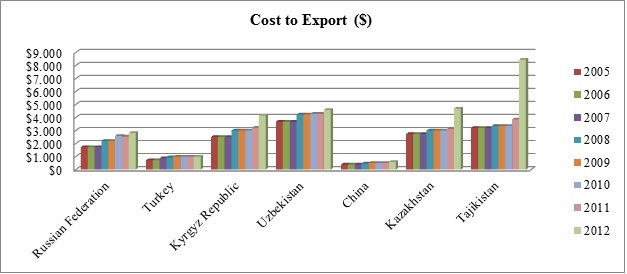
The figure 8 illustrates the cost to export; which simply means how much a country would pay in order to export to these countries listed in the figure. Per container prices show that Tajikistan is the most expensive country in SCO by its more-than-8.000 $ cost to export, due to the sharply increasing prices of main export-import products. Kazakhstan, Uzbekistan, Kyrgyz Republic and Russian Federation follow Tajikistan, respectively. China sparkles as the best country to start export among others by having the lowest cost to export while Turkey has close numbers to China. Tajikistan is considered as the worst.
Figure-8. Cost to Export (2005-2012)
Resource: The World Bank
Similar to the term of “cost to export”, cost to import measures how much it would cost to import into the country and it is shown in Figure 9 below. Tajikistan, again, has the most expensive prices per container for import to the country with its unstable economy. Uzbekistan, Kazakhstan, Kyrgyz Republic and Russian Federation follow Tajikistan in the same order. With its low labor force and price policy, China has the lowest costs for import and also a plus here: Turkey again has a significantly close cost of import prices to China.
Figure-9. Cost to Import (2005-2012)

Resource: The World Bank
Export volume indexes are derived from the volume index series of United Nations Conference on Trade and Development (UNCTAD) and they are the ratio of the export value indexes to the corresponding unit value indexes. The World Bank sets the index of 2000 as 100.
As it could be known easily, China has the highest export volume among all countries of SCO, and also one of leading countries in the world. Another significant point is that Turkey is also better than the rest of the all members of the organization.
Figure-10. Export Volume Index (2004-2011)

Resource: The World Bank
Export values are the current value of exports converted to U.S. dollars and expressed as a percentage of the average for the base period. The World Bank sets the index of base period as 100.
As it is seen in the figure, Kazakhstan has the most valuable export among other countries. Main export of Kazakhstan is oil, but another important fact is that Kazakhstan is the leading exporter of uranium, which is used as a fuel in nuclear reactors. China, Russian Federation, Turkey, Uzbekistan and Kyrgyz Republic are following Kazakhstan, respectively. Among all these countries, Tajikistan has the lowest export value.
Figure-11. Export Value Index (2004-2011)

Resource: The World Bank
Import volume indexes are derived from the volume index series of United Nations Conference on Trade and Development (UNCTAD) and they are the ratio of the import value indexes to the corresponding unit value indexes. The World Bank sets the index of 2000 as 100.
The import volume has been increased for all countries in SCO and also for Turkey. Import Volume Index was assumed 100 for 2000, Russian Federation has the highest import volume index with 500, while Turkey and Tajikistan have the lowest with around 200. China has almost the same index with Russian Federation. This figure also indicates how eager countries are to welcome export products.
Figure-12. Import Volume Index (2004-2011)

Resource: The World Bank
Import value indexes are the current value of imports (c.i.f.) converted to U.S. dollars and expressed as a percentage of the average for the base period (2000). The World Bank sets the index of the base period as 100.
Even though Russian Federation has the highest import volume index, in terms of the values, China leads in the organization with and index value almost 800, while Kyrgyz Republic and Kazakhstan are at almost the same level with China. Turkey has the lowest import value index around 420, which is the lowest just before Uzbekistan.
Figure-13. Import Value Index (2004-2011)

Resource: The World Bank
According to definition of The World Bank for Foreign Direct Investments (FDIs), foreign direct investment is net inflows of investment to acquire a lasting management interest (10 percent or more of voting stock) in an enterprise operating in an economy other than that of the investor. Foreign direct investment is assumed as the sum of equity capital, reinvestment of earnings, other long-term capital, and short-term capital as shown in the balance of payments.
In terms of net Foreign Direct Investments (FDIs) as Balance of Payments in US Dollar ($), China is the most effective country among all six countries of SCO and Turkey. With its crucial performance at FDIs, Turkey has positive numbers for last 8 years while Russia has been facing problems with FDI flows last 3 years.
Figure-14. Net Foreign Direct Investment (2004-2011)

Resource: The World Bank
According to the figure 15 showing countries' foreign direct investment net flows as % of GDP, six countries of SCO are examined. The results show that except Tajikistan, all other five countries are more effective than Turkey in terms of attracting foreign direct investments into their countries. Data which were taken from The World Bank show that these five countries performed better than Turkey in 2003 until 2005. In the last three years Kyrgyz Republic has been performing extraordinary performance by reaching to 12 % of GDP derived from foreign direct investments. Also Kazakhstan had an increasing trend of its performance for attracting FDIs until 2009, even though they had a sharp fall in 2010, it is possible to see that Kazakhstan will be able to have its old trend again.
Even though Tajikistan had a strong trend for attracting foreign direct investments into the country between 2004 and 2008, net inflows of FDIs for Tajikistan dropped dramatically in the last three years due to corruption and economic mismanagement. Turkey, one of recent strong players for FDIs, has a positive trend and increases to 2 % of its GDP as net FDI inflows in 2011.
Figure-15. Foreign Direct Investment Net Inflows (2004-2011)

Resource: The World Bank
Even though Kazakhstan had ups and downs, still they followed an increasing trend in their outflowing FDIs (in terms of % of GDP) and are assumed as having the best performance between 2003 and 2010 with its peak in 2010. Also, Russian Federation has a fixed FDI outflow between 2007 and 2011 with 3.5 % of its GDP. Meanwhile, Turkey had been making baby steps since 2003 about FDI outflows. No data is available for Uzbekistan and Tajikistan on The World Bank database.
Figure-16. Foreign Direct Investment Net Outflows (2004-2011)

Resource: The World Bank
Strength and Weakness
The table shows performances of the countries in order to view the comparison in all terms of indicators mentioned above. “1” is assumed as the best among others while “7” (could be “5” or “6” at some indicators, due to lack of data) is the worst.

*The data was taken for the year of 2007.
**The data was taken for the year of 2010.
Conclusion
Even though this work tries to show only the comparison between Turkey and members of SCO, there are few points to be underlined. This work does not imply subjective words to suggest whether to be a part of SCO. The conclusion only covers the notes of what Turkey might get if they would be part of the organization.
Turkey has been trying to have close ties with China, a big threat for all export-based and developing countries, in terms of trade with new protocols. One of the main reasons to consider SCO as beneficial to Turkey is the possibility to have better trade offers that Turkey would get with China instead of single protocols. This would put Turkey in a position as a strategic partner for China, rather than a “competitor”.
Russia, the main natural gas exporter to Turkey, is another reason to jot down the organization as a big plus for Turkey. If it is thought that one of the main reasons why Turkey has a large amount of current deficit is the energy import, than it must be pointed out that Turkish integration to the organization would make Russia look much better ally to Turkey in terms of energy trade.
New investment cooperation could be created as well: trade (both export and import) between Turkey and Kazakhstan has been rising in the last three years. Turkey that will have two new nuclear stations in Sinop and Mersin would benefit from this cooperation by acquiring uranium and oil with better conditions.
To understand the current trade between Turkey and Kazakhstan, latest data from the Turkish Ministry of Economy are taken: Kazakhstan ranked 31st among Turkey's most preferred exports destination and 27th among Turkey's major importers in 2011, in terms of merchandise trade.
Along with Russia, China and Kazakhstan, the other members of the organization would also encourage Turkey’s main trade focus by diverting it to new destinations. It must be remembered that integrations to different organizations/zones always provide new opportunities!
The links of countries’ investment agencies are listed below.
Kazakhstan - http://invest.gov.kz/
Uzbekistan - http://www.investuzbekistan.uz/
Tajikistan - http://www.tajinvest.tj
Russia - http://invest.gov.ru/en/
Kyrgyzstan - http://www.kyrgyzinvest.com/en/general.php